Money never sleeps ... even on a saturday night


Lately I have been lazy and lacking inspiration to write about or research the markets.  I have been on a vacation and it is now time to pull myself together and start seriously back testing my new startegy. 

I am working on a strategy that takes into account both fundamental and technical factors. This strategy is a blend O´neills investment philosophy and trend following. Since I have no idea where the markets are heading it is smart to stay outside, observe and research. In Chinese the word "Crisis" means also opportunity, so if we are going to have a period of a bear market I will be then ready when the markets are turning and instruments are undervalued.

To trade like an institution


First of all let us define what an institutional investor is. Investopedia.com defines an institutional investor as follows: A non-bank person or organization that trades securities in large enough share quantities or dollar amounts that they qualify for preferential treatment and lower commissions. Instituional investors face fewer protective regulations because it is assumed that they are more knowledgeable and better able to protect themselves.

Hereby we can assume that investopedia is reffering to pension funds, mutual funds, hedge funds, insurance companies, investment banks etc. The institutional counterpart has a larger amount of equity to invest than an average commercial trader and the reasons why they trade a specific instrument can have various backgrounds: An institution might buy an instrument to close a short position or it might buy so that its mutual fund fills a specific fund criteria. Usually institutional trading can be noticed trough the order book, or watching the trade volume. As per se the institutions trade high volume contracts they might buy in blocks so that the market supply is enough and their market exposure is not too obvious. The funds originate mostly from the customers deposits. As the institution is obligated to maximize the customers returns it simply cannot spray it´s funds around the market. An institution trades relying on a definitive trading strategy. This strategy has been back tested and has been approved by the board. Thus we can define a few important steps to start trading like the big boys do:

1. Create a trading strategy that is easy to understand and has definitive conditions ( can be explicated in a mathematical equation, technical parameters or code) 


2. Back test the strategy (e.g. manually or by programming it). Try to be as realistic and objective as possible. 


3. If the strategy shows satisfying returns write the strategy down and hang it on the wall next to your trading station


4. Trade ONLY on the basis of the strategy! Rely on your strategy since it has proven to be somewhat profitable in the back testing phase. Every strategy shows negative returns at times. These periods may take several days to weeks, even months.


5. Put every trade in a table (e.g. an excel sheet) and derive statistics from them. Every trade has to be written down and rationalized with your strategy. In the future you can then look back at the failures and even try to avoid them in the future. 

My recent trades

Delta Air Lines (DAL) long position
 Facebook (FB) Long position
Fresenius Medical (FMEG) Long position 
 Neopost (NPOS) Short position
Axel Springer (SPRG) Long position ended up with a huge loss here. The market took my position out with the trailing stop order. Should have avoided the big candles. 

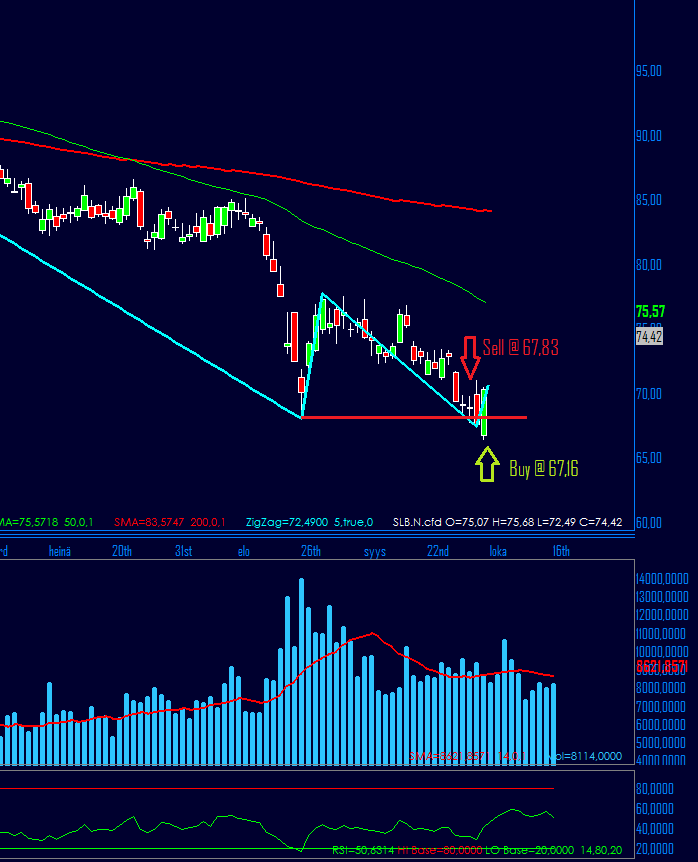
Schlumberger (SLB) Short position


Will the Dax go further down?

We can see a similar drop on the DAX as on the 31.7.2011 but only now there is some significant volume. If the German stock index is about to plunge more, we have good opportunities to sell short. The trend is bearish on the daily chart but looking at the bigger picture on the weekly chart we still can talk about a correction.

My recent position trades

 Deutsche Telekom (DTEGn) on a 4 hour chart. Buy @ 16,640 because crossover point 2. Sell via trailing stop.

Hochtief (HOTG) on a 4 hour chart. Buy @ 72,393 sell at 75,527. Buy because of crossover point 2. Trailing stop exit. 
 Osram Licht (OSRn) on a 4 hour chart. Buy at 50,813 sell at 53,890. Signal was given by market crossing over point 2. Trailing stop exit.


Keep calm and follow your trading plan

.. is something that is good to repeat to yourself, when a position runs against you or a friend tells you about a new "hot stock". I am nobody to tell you about success in trading, but as much as I have observed other traders, the ones who make trading decisions on a gut feeling end up loosing their money. Also traders who allocate all their equity on one instrument often end up being wrong. 

As much as I know, professional traders do not trade like this. The winners are the ones who have a very specific trading plan. The trading plan has been tested and implemented and a track record of years proves that it works. Success in trading is not about risking all equity in one good trade. It is about a system that tends to beat the market on the longer term. A system with tight stops for example, can be profitable even if it is 1/5 times right. The stops cut the losses short and the winning trade breaks the losses even. "let your winners run" is a phrase which you can read in many books. It is true but you should never limit your scope with phrases like this. Some traders are satisfied with as little as 10 pips per day. These traders could make the 10 pips in the morning and then do something else. 10 pips does not sound like much but imagine trading those 10 pips with large volume. 

Moreover it is important to keep some kind of track of your trades. Imagine trading endlessly and never making one note of your past trades. That way you could not draw any conclusions from you trades. An Excel sheet comes in very handy for this specific matter. In excel you could keep very good track of your trades. One could make a table which computes the standard deviation of the returns, derive volatility from the standard deviation and then calculate the VaR (value at risk) on a daily basis. Also a last touch could be adding a column where one could add always the signal or reason why the specific trade was executed. This way one could always look back at the failures and analyze how to avoid them in the future.

Technical & fundamental data working together on the EURODOLLAR


On the 2nd of June there was a news event where the change of the European Consumer Price Index was announced in percentages. In the picture below we have the EUR/USD pair on a hourly chart. The change was announced at 12:00 am (GMT +2) at the same time the currency was on a significant technical level of 1,10061 which was the previous high. According to the market structure crossing this level triggered some buy orders, which already stood in the orderbook. Therefore the currency launched to a strong intraday trend. In the picture the blue line indicates when the change was announced and the red line indicates a trailing stop scenario. Underneath we have the volume indicator to indicate the significance of this event.