Näytetään tekstit, joissa on tunniste Technical Analysis. Näytä kaikki tekstit

MeetMe Inc. (MEET)

MeetMe, Inc. is a social media technology company that owns and operates the MeetMe mobile applications and meetme.com. The Company is a location-based social network for meeting new people both on the Web and on mobile platforms, including on iPhone, Android, iPad and other tablets that facilitate interactions among users. The Company provides users with access to a menu of resources that promote social interaction, information sharing and other topics of interest. The Company offers online marketing capabilities, which enable marketers to display their advertisements in different formats and in different locations. (google finance)

The stock price is in an accelerating bullish movement well above the 200 day moving average. The price plunged after some director’s offloaded shares in august. This may indicate that the Q3 earnings report will not be as positive as the Q2:


However if the Q3 report is surprisingly positive I am looking forward on buying at 8,20$. 4 analysts have rated the stock as a “buy” and none as “sell” or “underperform”.

Stock of the week

I am slowly moving away from day trading to swing trading or trend trading, since my daily job does not allow me to follow positions throughout the day. That is why I am working on a strategy which requires me to take a look at the positions after the closing bell. I am not moving away from technical analysis though, but I am increasing the significance of fundamental data. The strategy will follow William O´neill´s strategy and Michael Voigt´s represented "market technique". From this point on I will try to find an interesting stock every week and maybe trade it. I will write a short blog entry about it so that I can in the future look back how my recommended stocks performed. The markets are not good at the moment so I doubt they perform in the near future well.

Dycom Industries Inc. (DY)

Dycom’s business primarily benefits from increased demand for network bandwidth and mobile broadband, given the proliferation of smart phones. The company has been continuously benefiting from extensive deployment of 1-Gigabyte wireline networks by major customers. Most of the telecommunication companies are deploying fiber-to-the-home and fiber-to-the-node technologies to enable video offerings and 1-gigabit high-speed connections, thereby opening up significant opportunities for Dycom. As the picture below shows, the company´s  quarterly and annual numbers look promising. The stock has also a 89% institutional ownership and it´s stock is ranked number one among the competitors according to IBD ( Investors Business Daily).

 The only problem my strategy is facing with this stock is the risk/ reward ratio. Assuming the stock would increase in value by 50% and having a price of 94,98$ the stop order at 46,61$ we get a ratio of 54%. Also considering the order costs, I am risking 46% more than my theoretical profit could be. A good ratio would be above 100%. That is why I am only watching this stock. Maybe the price will form a new bottom soon, so could set the sell stop order on a more reasonable level.


To trade like an institution


First of all let us define what an institutional investor is. Investopedia.com defines an institutional investor as follows: A non-bank person or organization that trades securities in large enough share quantities or dollar amounts that they qualify for preferential treatment and lower commissions. Instituional investors face fewer protective regulations because it is assumed that they are more knowledgeable and better able to protect themselves.

Hereby we can assume that investopedia is reffering to pension funds, mutual funds, hedge funds, insurance companies, investment banks etc. The institutional counterpart has a larger amount of equity to invest than an average commercial trader and the reasons why they trade a specific instrument can have various backgrounds: An institution might buy an instrument to close a short position or it might buy so that its mutual fund fills a specific fund criteria. Usually institutional trading can be noticed trough the order book, or watching the trade volume. As per se the institutions trade high volume contracts they might buy in blocks so that the market supply is enough and their market exposure is not too obvious. The funds originate mostly from the customers deposits. As the institution is obligated to maximize the customers returns it simply cannot spray it´s funds around the market. An institution trades relying on a definitive trading strategy. This strategy has been back tested and has been approved by the board. Thus we can define a few important steps to start trading like the big boys do:

1. Create a trading strategy that is easy to understand and has definitive conditions ( can be explicated in a mathematical equation, technical parameters or code) 


2. Back test the strategy (e.g. manually or by programming it). Try to be as realistic and objective as possible. 


3. If the strategy shows satisfying returns write the strategy down and hang it on the wall next to your trading station


4. Trade ONLY on the basis of the strategy! Rely on your strategy since it has proven to be somewhat profitable in the back testing phase. Every strategy shows negative returns at times. These periods may take several days to weeks, even months.


5. Put every trade in a table (e.g. an excel sheet) and derive statistics from them. Every trade has to be written down and rationalized with your strategy. In the future you can then look back at the failures and even try to avoid them in the future. 

My recent trades

Delta Air Lines (DAL) long position
 Facebook (FB) Long position
Fresenius Medical (FMEG) Long position 
 Neopost (NPOS) Short position
Axel Springer (SPRG) Long position ended up with a huge loss here. The market took my position out with the trailing stop order. Should have avoided the big candles. 

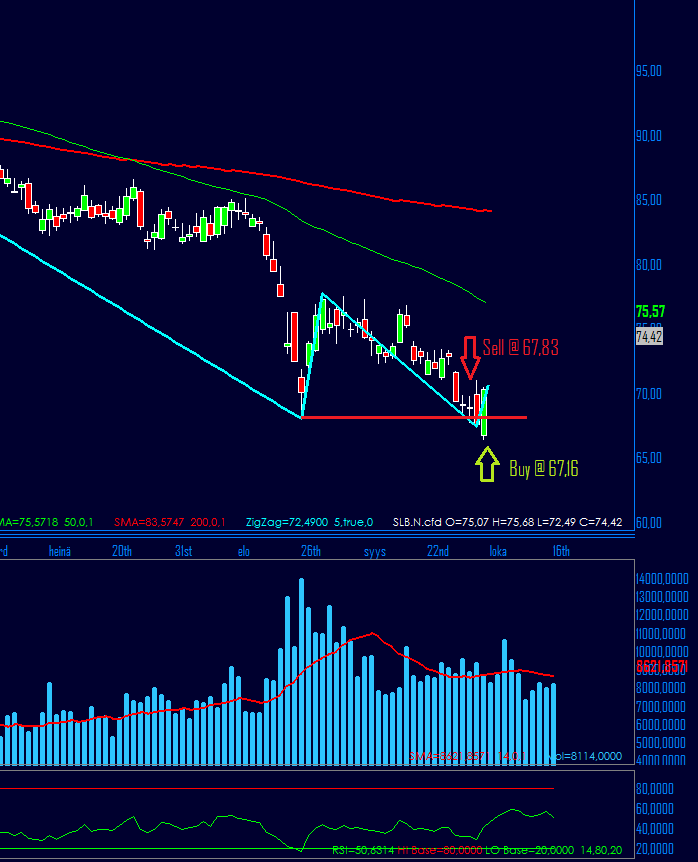
Schlumberger (SLB) Short position


Will the Dax go further down?

We can see a similar drop on the DAX as on the 31.7.2011 but only now there is some significant volume. If the German stock index is about to plunge more, we have good opportunities to sell short. The trend is bearish on the daily chart but looking at the bigger picture on the weekly chart we still can talk about a correction.

My recent position trades

 Deutsche Telekom (DTEGn) on a 4 hour chart. Buy @ 16,640 because crossover point 2. Sell via trailing stop.

Hochtief (HOTG) on a 4 hour chart. Buy @ 72,393 sell at 75,527. Buy because of crossover point 2. Trailing stop exit. 
 Osram Licht (OSRn) on a 4 hour chart. Buy at 50,813 sell at 53,890. Signal was given by market crossing over point 2. Trailing stop exit.


Keep calm and follow your trading plan

.. is something that is good to repeat to yourself, when a position runs against you or a friend tells you about a new "hot stock". I am nobody to tell you about success in trading, but as much as I have observed other traders, the ones who make trading decisions on a gut feeling end up loosing their money. Also traders who allocate all their equity on one instrument often end up being wrong. 

As much as I know, professional traders do not trade like this. The winners are the ones who have a very specific trading plan. The trading plan has been tested and implemented and a track record of years proves that it works. Success in trading is not about risking all equity in one good trade. It is about a system that tends to beat the market on the longer term. A system with tight stops for example, can be profitable even if it is 1/5 times right. The stops cut the losses short and the winning trade breaks the losses even. "let your winners run" is a phrase which you can read in many books. It is true but you should never limit your scope with phrases like this. Some traders are satisfied with as little as 10 pips per day. These traders could make the 10 pips in the morning and then do something else. 10 pips does not sound like much but imagine trading those 10 pips with large volume. 

Moreover it is important to keep some kind of track of your trades. Imagine trading endlessly and never making one note of your past trades. That way you could not draw any conclusions from you trades. An Excel sheet comes in very handy for this specific matter. In excel you could keep very good track of your trades. One could make a table which computes the standard deviation of the returns, derive volatility from the standard deviation and then calculate the VaR (value at risk) on a daily basis. Also a last touch could be adding a column where one could add always the signal or reason why the specific trade was executed. This way one could always look back at the failures and analyze how to avoid them in the future.

Technical & fundamental data working together on the EURODOLLAR


On the 2nd of June there was a news event where the change of the European Consumer Price Index was announced in percentages. In the picture below we have the EUR/USD pair on a hourly chart. The change was announced at 12:00 am (GMT +2) at the same time the currency was on a significant technical level of 1,10061 which was the previous high. According to the market structure crossing this level triggered some buy orders, which already stood in the orderbook. Therefore the currency launched to a strong intraday trend. In the picture the blue line indicates when the change was announced and the red line indicates a trailing stop scenario. Underneath we have the volume indicator to indicate the significance of this event.


SANOFI

The beginning of april gave some strong bullish signals. One of them occured with the sanofi´s stock. The conditions were one every timeframe bullish. I opened the position on the 1 of april at 93,46€ and it got closed due the stop order on the market opening of the 16th of april due an gap down at 97,39€.

A couple of trades

These trades were rather following a position trading strategy since they were kept through several days. The first one was traded with the BNRGn (Brenntag Ag). Open at 53,53 and close at 55,16 with a 163 point difference. The first picture illustrates the instrument on the daily chart. We can see that the price had just recovered from a minor drop and the trend is strong bullish. 


 BNRGn (Brenntag Ag) on the 15 minute chart where the trade was executed. This is  one of those trades where I placed the stop order just right. The price started oscillating with high volatility just after the position was closed on the 17th of march. Green line entry, red line exit. 

 The second trade was executed also with a stock derivative of the German market. G1AG (Gea Group) Firstly the daily chart, then the 15 minute chart.

 The picture does not quite show that actually the the first low in the picture is many points below the second (higher) low. This observation made me trade this movement. The exit was executed with a market order, since the stop was  lying down at 43,90 and the instrument started showing reversal signs on the 17th ( a reversed 1-2-3 pattern).

Where the first two trades were long positions, the third was held short. This was exercised with the CHK (Chesapeake). This stock has been extremely bearish since the middle of 2014. The position was entered at 15,04 where the price broke through the last low. The 15 minute chart illustrates that the entry point had clearly some bearish volume, since the price plunged immediately. The position was closed manually with a market order due to a possible reversal. A 103 point trade. 


December

I have recently been busy writing my thesis, and now that it has been graded and published I would like to do a short review about the subject. 

The quantitative research was carried out by first introducing concepts of technical analysis and by studying historical price data from a five-year time frame. The price data of the instruments was selected randomly from four different samples of asset classes. These segments included then 18 different derivative instruments. The price charts were then studied form a market technique- based strategy’s viewpoint: The strategy aims to find spots in the market, where movement will appear probably. The periods, through which the prices were studied, were also selected randomly from a 20-year timeframe. These fictitious order executions were obtained by entering the buying and selling signals into a table.  From these prices could then be the instruments behavior describing statistics derived.
 The results of the different instruments can be seen in the following pictures.

 In the first two columns we can see how many bullish, bearish and neutral periods each instrument had. Then we have columns with the signals given by the tested strategy,


Where the yellow highlighted cells represent numbers that are sums and the grey areas averages.


The quantitative results of the research showed that technical analysis can be used to some extent to gain continuously positive returns. As the research showed that instruments behave differently, the measure of profitability depends highly on the perspective from which the results are examined. Altogether, the scope of this study was to investigate, analyze and develop the field of technical analysis. As we can see in the tables, the commodities and index derivatives were clearly the most profitable instruments on average. The presented strategy represents a simple trend detection method that can easily be enhanced by adding terms and conditions.

What happens next ?


According to a market technical strategy, we would have a bundle of sell orders just waiting to be filled below the recent low. But according to some other technical strategies, now would be a good time to buy. If the recent low will be broken, the DAX will most definitely be in a bear market at least the rest of the year.


Since we have a 96% correlation between the Dax and Eurostoxx, the same applies here. I am looking for a pullback and a movement trough 2972,7 that is where I place my order. I am also open for a major bullish correction.

Some successful trades I made this week

Although my bachelors thesis will be written about a market technical strategy, I haven´t had much time to monitor the markets. Still I managed to pull of some positive returns with FTSEMIB and IBEX 35. Since the week started looking bearish on those indices, I was positioned bearish myself.
Despite we do not have definite sings of a trend  reversal on the weekly chart with these indices, the daily chart is starting to look like a bear market.
                                                             
                                                                    IBEX 35 H1
FTSEMIB H1


Always look at the big picture

Like you should not have a long position on the S&P 500 at the same time as you are short on the Dow Jones, you should apply the same rule to different time frames. A trader should always remember to look first  at the "general weather situation" before moving on to smaller time frames. One can see a trend reversal on a 15 minute chart but when looking at the daily chart, it appears only to be a correction of a bullish trend. The "the trend is your friend" rule applies also here.

Here is one example of a well constructed position:

Picture 1. We start the trading session by looking at the daily EUROSTOXX chart. We are                   now at breaking point 2 and see that this could be used as a trend confirmation.

Picture 2. Next we move to a samaller timeframe, for example the hourly chart. We can now identify a formation here and place our order. The direction of the position is now the same as the direction of the main trend.

Picture 3. to give you a hint what it would look like on the 15 min chart.

Volatility adjusted position sizes

We know that  volatility is derived from the past changes of the securitys price and we know it is calculated by multiplying the square root of time in years with the standard deviation of the securitys price within that timeframe.
What I am interested about, is using it to determine position sizes and its effects on reducing losses. Volatilty can work on one´s favor or  it can also lead to major losses. The volatility index is known as the "fear index" which indicates the bad times for stock options. 

 Volatility adjusted positions are crucial for reducing risk. A position could be determined by subtracting the current volatility percentage from 1 and multiplying the factor with the usual contract size. Obviously your broker must offer splittable contracts or then you have to trade large amounts to enter such positions. Also cfd (contracts for difference) brokers offer microlots to trade with.

                                                           VAP. = (1- Vola%) * contract size
                                                                                or
                                                           VAP.= (1-√T*σ) * contract size


What about gold?

XAUUSD with Simple Moving Averages 200 and 50

As we know gold as the safe haven for investors, we may have some potential to buy in the near future .
Last week major stock indexes declined and as soon as they start to trend down we know there is a lot "air" for gold. On the other hand, blue chip companies have had a great year and therefore ivestors are holding on the stocks to receive generous dividends. Moreover there is  a rumor about gold that the Indian government would loosen their tight regulation regarding importing gold.

From the technical perspective, we had almost a breakout of the downtrend last week at 1.268, but it turned out to be a testing of the resistance or false breakout. As soon as we have some 1,2,3 formations and a breakout over the 2, I would buy. A turbo-long certificate would be the suitable. A drop below 1.180 would mean, that it is still a bearish climate.

Potential trade for the year 2014?

Investors celebrated the year 2013 taking home some big profits. The stock index that rose the most was the Venezuelan IBC Index. With 2706,38 points and 474,1 percent it was the ultimate outperformer. After that came the DFM-General index with 99,9 percent. As third came the Argentinian index Merval. The Japanese Nikkei 225 index landed as fourth with 52,7 percent in performance. The Finnish HEX performed 23,1 percent and was 17th.

As it remains a little uncertain whether these indices keep rising, we can take a look elsewhere, e.g. the weekly chart of EUR/PLN spot price.  Massive triangle formation. I am not saying this will happen, but there is a probability. And that is what trading is based on: Probabilities.


Stocks for 2014

As Gold´s price keeps declining, investors move more and more their money into stocks. That is why it is a good time to make some stock picks for 2014.

Since AAPL suffered the biggest price decline in 2012 it seems that it is now in a steady trend making higher highs and lows.  Analyst speculate it to climb to 700 in the next 12 to 18 months. There is also a rumor that the company will be launching "wearable technology", something similar to Samsungs products. 

At the beginning of November Wall Marts (WMT) Stock price broke out of a bullish flag formation reaching an all-time high of 81,37. After that the stock consolidated to 77,80 which is significant and offers a great point to place the stop. So now we are waiting for a breakout over the A-TH.

Let´s wait that Nokia´s (NOK1V) stock will break over 6,0. Analysts are estimating Nokia to give out a dividend of 0,4 euros.