Näytetään tekstit, joissa on tunniste Day Trading. Näytä kaikki tekstit

Algorithmic Trading

Lately I have been lazy to write any blog entries but I have been productive with trading, more specifically regarding my development on the journey to a better trader. I met a good old friend who seems to be doing pretty good in trading. He said his strategies are mostly algorithmic which strengthens my interest towards aromatic trading. I have many times thought about back testing my strategies automatically with coding, but did never give a thought that algorithmic trading was ever an option. 

Algorithmic trading is the act of programming a trading system to work on its own. I mostly thought that is what big firms on Wall Street do and that normal commercial traders would never survive in that world. Most people think that an algorithmic trading strategy is also a quantitative strategy, in which case we are talking about high frequency trading. This is a world of ultra fast trading where nano seconds matter and trades are already made 0,00001 seconds after a news event. Obviously this is where commercial traders have no chances to compete. But an algorithmic trading strategy can also be a system that makes for example "buy and hold" long term investment decisions. A strategy that is automated fully or partly can be an algorithmic strategy. I was eager to learn as much as  possible about algorithmic trading and I think these are the pros and cons of it:

An algorithmic trading system:
+ can work on its own 24/5
+ will exclude all negative effects of the human mentality (greed, fear and inaccurateness)
+ will do a 100% what you program it do 
+ will simultaneously monitor as many markets as you want it to follow

- can be difficult or even impossible to program
- can sometimes lead to "black swans" (negative inexplainable surprises)
- can take a lot of time to develop

I first came up with a  fantastic internet site https://www.quantopian.com, This is a free forum and portal for algorithmic traders and I believe its free because succeeding strategies are copied by the site owner so do not code your biggest trading secrets here. The site has a build in python-based terminal for back testing and live trading. It uses python as its coding language which is pretty easy to learn and powerful. I played a little with it but soon realized I would need at least a +30K trading account to trade with this on an intraday basis. I don´t have the money and the will to sacrifice 30K to my first algorithm which may work or not work.
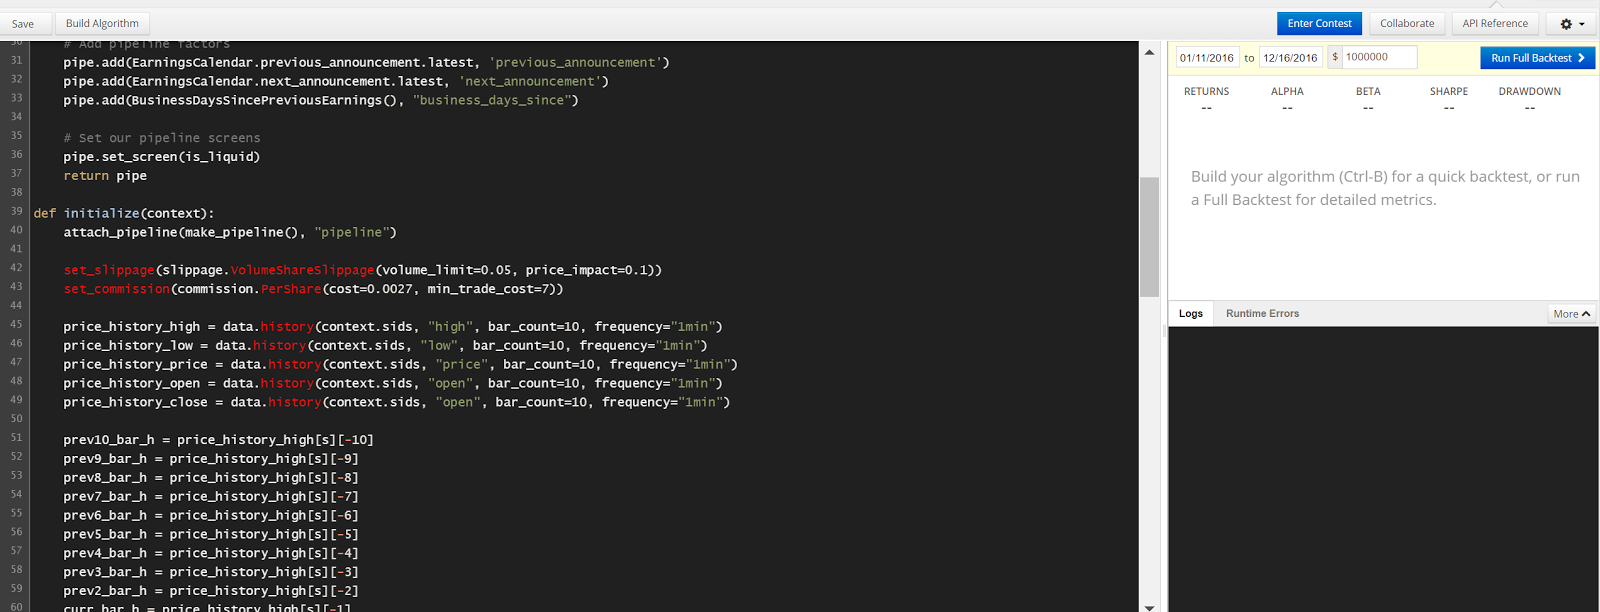

Then I came up with the good old Meta Trader which is offered mostly by forex brokers https://www.metaquotes.net/. The metatrader uses MQL 4& 5 (meta quotes language) as its programming language. The syntax is very similar to C++ which is considered to be a difficult but very powerful language. To me the language seemed first very difficult to understand, but it is getting more clear the more I put time to look into it. So this is where I am right now: I have to master MQL so that I can write my strategy into code.

Intraday News Trading

I usually trade some news events during the week. One of those is the crude inventory release. The number is released every Wednesday at 17:30 (GMT +2) and on US holidays on Thursday at 18:00. This is an exciting news event since it brings a lot of volume into the market. Last Thursday I traded the news only to find myself after a few minutes with a big loss in my account. The news came out as Actual 4.900M Forecast 0.650M Previous -2.976M. That means there is a 7,87 million barrel difference to the previous number. An increase means always more supply and more supply means the price should fall. And so it did for a few minutes. As the first 5 min candle was closed I opened a position at the previous low. Shortly after that the price rapidly increased. I had my stop at 51,64 which is the high of the first candle. The price just kept increasing until my position was closed. Not that I am afraid of losing, but sometimes I have the feeling the market is doing the direct opposite of what it should or at least what I think it should do. I checked that there were no other contradicting news released that could have mixed the sentiments. How on earth did the market analyze the news as bullish for the oil price??!


The price just returned back to its original level like the market would have said "nope you are wrong, I will knock you out!". In my opinion it is not worthy for a single trader like me to enter any trades during the first 5 minute candle: the first 5 minutes tend to be very volatile and entering a trade could be affected by high slippage or an instant stop order. I have also noticed that the market often overreacts and the price will eventually change direction after the first candle like in this case.

Update on Sabre Corp. (SABR) 6.9.2016

The stocks price has made a new low and is rising again towards the all-time-high. I am predicting volume increase at levels between 29,66 and 30,60. Buy signal if the price manages to close above 30,60.  
Weekly chart:
Sabre released some solid numbers on the 2nd of August: Quarter over quarter earnings growth 113%, ROE (ttm) 84%, Sales quarter over quarter 19,50%. Despite that the stocks price reacted bearish. Overall the stock is in a bullish cycle.
Daily chart:


My recent trades

Delta Air Lines (DAL) long position
 Facebook (FB) Long position
Fresenius Medical (FMEG) Long position 
 Neopost (NPOS) Short position
Axel Springer (SPRG) Long position ended up with a huge loss here. The market took my position out with the trailing stop order. Should have avoided the big candles. 

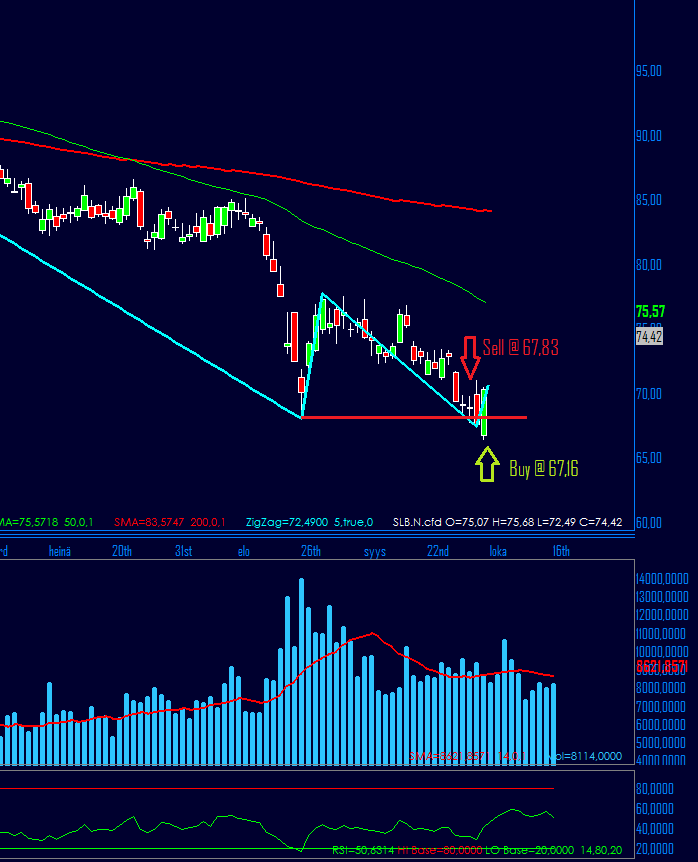
Schlumberger (SLB) Short position


Will the Dax go further down?

We can see a similar drop on the DAX as on the 31.7.2011 but only now there is some significant volume. If the German stock index is about to plunge more, we have good opportunities to sell short. The trend is bearish on the daily chart but looking at the bigger picture on the weekly chart we still can talk about a correction.

My recent position trades

 Deutsche Telekom (DTEGn) on a 4 hour chart. Buy @ 16,640 because crossover point 2. Sell via trailing stop.

Hochtief (HOTG) on a 4 hour chart. Buy @ 72,393 sell at 75,527. Buy because of crossover point 2. Trailing stop exit. 
 Osram Licht (OSRn) on a 4 hour chart. Buy at 50,813 sell at 53,890. Signal was given by market crossing over point 2. Trailing stop exit.


Understanding (technical) market structure


Let us start with the picture above. We have three types of bullish trends: the accelerating bullish trend A, the regular bullish trend B and the decelerating bullish trend C. In an accelerating bullish trend the price makes higher highs and lows alternately making a "convex" slope. The trend is considered to be stronger than the trends B and C. The trend C again is losing momentum and is drawing a more "concave" pattern.

 We can find some theoretical "support" points and draw trend lines (yellow with trend A, orange with trend B and grey with trend C). In the trends A and B, one has to draw multiple lines, because the trends momentum is increasing/ decreasing. In trend B the trader is satisfied to draw only one line, which runs through all lows of the price slope.

One can find very effective entry points at the price level where the price embarks through the previous highs level (E). Adding a volume  indicator or looking at the order book at these levels, usually shows some significant order flow. This is where market technique oriented traders (private and institutional) traders enter their position. A trend following trader could set his/ her stop orders at the previous lows level. E.g. Entry at point E1. After the entry the trader wants to protect his/ her position and puts a stop order to the level S1 (only after the price has significantly risen through E1!)

A bullish trend makes alternately higher highs and lows. To exit the train at the right stop we have to understand when the trend has been broken and when it is reversing. Point B1 is the first lower low to appear ( its level is below the previous low). Many traders might hesitate and close their position now, where the trend might as well continue in the initial direction. However the price does another peak B2 which is a lower high. The price continues to drop below the previous lows level B3. Now the trend is considered to be reversed ( bearish) This is the last point where one should get rid of the position. Here the price usually makes rapid movements, since traders have set their stops here and some of them are changing from optimist to pessimist and reversing their position. This causes strong volume on the sell side.

This concept can be used from tick-time frames to weekly charts, but one has to keep in mind that the superior time frames set the major "winds" of the market: it is recommended to trade a bullish trend on the shorter time frames, when the trend is also bullish on the longer time frames.

Oil

Everybody is aware that oil has been falling like crazy lately, but nobody seems to understand why it has been increasing in value rapidly last week. Many are speculating the price will hit 30$ per barrel this year. Other say it will hit 200$. I do not care for the fundamentals as long there is a trend in tact. For me the trend is still bearish on the long run and I would prefer to sell rather than buy. Some possible short positioning illustrated below:

BRENT CRUDE OIL x 100 1H  CHART


                                      BRENT CRUDE OIL x 100 15M CHART

What happens next ?


According to a market technical strategy, we would have a bundle of sell orders just waiting to be filled below the recent low. But according to some other technical strategies, now would be a good time to buy. If the recent low will be broken, the DAX will most definitely be in a bear market at least the rest of the year.


Since we have a 96% correlation between the Dax and Eurostoxx, the same applies here. I am looking for a pullback and a movement trough 2972,7 that is where I place my order. I am also open for a major bullish correction.

Some successful trades I made this week

Although my bachelors thesis will be written about a market technical strategy, I haven´t had much time to monitor the markets. Still I managed to pull of some positive returns with FTSEMIB and IBEX 35. Since the week started looking bearish on those indices, I was positioned bearish myself.
Despite we do not have definite sings of a trend  reversal on the weekly chart with these indices, the daily chart is starting to look like a bear market.
                                                             
                                                                    IBEX 35 H1
FTSEMIB H1


How the quants of wall street affect the financial markets


When it takes about four seconds a human to read a tweet, an algorithmic trading system needs only a few microseconds to read a significant article, process the information and make trades. A human can´t compete with these algorithms, since it takes a human brain too long to process the same amount of information.  These algorithms have created a new ecosystem in the recent five years that is taking over. It seems scary that the markets are no longer controlled by humans, because we are dependent on commodities. Sean Gourley explains the "ecosystem"  of algorithmic trading in the following video. 


EUR/RUB about to breakout


The crisis between Ukraine and Russia has been affecting the EUR/RUB currency pair so that it is now in a steady bullish trend. A market technical entry at 50.820 will most definitely work. There is also a probability for a small correction movement just before the breakout. Pay attention to the volume to avoid  false entry.

+


Volatility adjusted position sizes

We know that  volatility is derived from the past changes of the securitys price and we know it is calculated by multiplying the square root of time in years with the standard deviation of the securitys price within that timeframe.
What I am interested about, is using it to determine position sizes and its effects on reducing losses. Volatilty can work on one´s favor or  it can also lead to major losses. The volatility index is known as the "fear index" which indicates the bad times for stock options. 

 Volatility adjusted positions are crucial for reducing risk. A position could be determined by subtracting the current volatility percentage from 1 and multiplying the factor with the usual contract size. Obviously your broker must offer splittable contracts or then you have to trade large amounts to enter such positions. Also cfd (contracts for difference) brokers offer microlots to trade with.

                                                           VAP. = (1- Vola%) * contract size
                                                                                or
                                                           VAP.= (1-√T*σ) * contract size


What about gold?

XAUUSD with Simple Moving Averages 200 and 50

As we know gold as the safe haven for investors, we may have some potential to buy in the near future .
Last week major stock indexes declined and as soon as they start to trend down we know there is a lot "air" for gold. On the other hand, blue chip companies have had a great year and therefore ivestors are holding on the stocks to receive generous dividends. Moreover there is  a rumor about gold that the Indian government would loosen their tight regulation regarding importing gold.

From the technical perspective, we had almost a breakout of the downtrend last week at 1.268, but it turned out to be a testing of the resistance or false breakout. As soon as we have some 1,2,3 formations and a breakout over the 2, I would buy. A turbo-long certificate would be the suitable. A drop below 1.180 would mean, that it is still a bearish climate.

Trailing stop by Michael Voigt

I recently read a book written by Michael Voigt that deals with breakout strategies. It also puts forth a trailing stop strategy for break out traders. The pros of the stop are, that it works in every market and on every time frame. The cons are that it does not work with highly volatile instruments that oscillate a lot.

The basic idea of the trailing stop is to "trail" the price. The stop is basically moved  to the closing price of the previous period. However there are some enhancements added to it.

The most important one, is observing the price movements that show signs of oscillation. Always when the price opens and closes within the area of the previous period, we are talking about an "inside bar". The inside bar has nothing to do with candlestick formations. Often when there is an "inside bar" the price tends to oscillate within the next periods. So the stop should be dragged to the close of the period before the previous.

So here is the OMX Helsinki 25 Index on the daily timeframe. As you can see the stop works well when the market is in a trend and continues to make higher highs and lows.

Potential trade for the year 2014?

Investors celebrated the year 2013 taking home some big profits. The stock index that rose the most was the Venezuelan IBC Index. With 2706,38 points and 474,1 percent it was the ultimate outperformer. After that came the DFM-General index with 99,9 percent. As third came the Argentinian index Merval. The Japanese Nikkei 225 index landed as fourth with 52,7 percent in performance. The Finnish HEX performed 23,1 percent and was 17th.

As it remains a little uncertain whether these indices keep rising, we can take a look elsewhere, e.g. the weekly chart of EUR/PLN spot price.  Massive triangle formation. I am not saying this will happen, but there is a probability. And that is what trading is based on: Probabilities.


Stocks for 2014

As Gold´s price keeps declining, investors move more and more their money into stocks. That is why it is a good time to make some stock picks for 2014.

Since AAPL suffered the biggest price decline in 2012 it seems that it is now in a steady trend making higher highs and lows.  Analyst speculate it to climb to 700 in the next 12 to 18 months. There is also a rumor that the company will be launching "wearable technology", something similar to Samsungs products. 

At the beginning of November Wall Marts (WMT) Stock price broke out of a bullish flag formation reaching an all-time high of 81,37. After that the stock consolidated to 77,80 which is significant and offers a great point to place the stop. So now we are waiting for a breakout over the A-TH.

Let´s wait that Nokia´s (NOK1V) stock will break over 6,0. Analysts are estimating Nokia to give out a dividend of 0,4 euros. 

Observing A Trend From A Market Technicians Viewpoint

There are many books about technical analysis out there, that are full of chart setups and candle stick analyses, but what they usually don´t have, is the explanation of traders behavior in a specific market situation. A successful daytrader, knows where the majority of traders have placed their stop orders and limit orders. That information is enough to make a successful trade, since where the orders are placed there will usually emerge a larger movement.

Lets have a look at the SP500 daily chart.

The blue dotline indicates the way of the trend. In general, trendfollowers usually set their stops above or below the last high or low, depending on the position of course. So if we look at the first 1,2,3 formation, we can see that when the price hits the significant high 2 the price breaks out. So the price reached above the last high and triggered stop orders from those who were positioned short. So short sellers have to buy the security and sometimes they even turn their position, which means they have to buy twice as much. And also many traders have their buy orders placed above the line.That is why often, but definitely not always, there comes movement into the market when crossing a significant high or low.  

That explains also why a breakout of a triangle formation has so much volume. The price oscillates up and down, but not making higher highs or lower lows. As the range of the movement gets smaller and smaller, eventually the price breaks out of the formation skyrocketing or falling. The traders move their sell and buy orders outside of the triangle and when the price breaks the formation, it triggers the bundle of orders. 

S&P 500 still bullish despite US Federal Government shutdown

The S&P 500 seems to be still bullish despite the US government is shutting down. The index is currently trading in historical highs and keeps being bullish as long as previous lows will not be broken and new highs will be reached.


The red lines indicate where the stops should be placed.

A little bit about goal setting ..

I think it is essential for every trader to set goals in life. I read recently the popular book "Think And Grow Rich" written by Napoleon Hill. Napoleon Hill was given the task to examine the most successful people, by that time the most wealthy man Andrew Carnegie. The reason Andrew gave Napoleon the task, was that he had one of the qualities that successful people have, "do more than people expect from you". That means that in every task, he works harder than he is paid for. The books title does not refer only to accumulate materialistic riches, but also how to get a life with love, friends, no fear of failure, living healthy and being confident.

The basic principles to success are:

1. Set one main goal in life
2. Set secondary goals that lead to the main goal
3. Program yourself into success mode

The principle is to program your subconscious mind in accepting yourself as a success. You have to dream every day about your main goal and imagine yourself as you are when you have obtained it. If you want to be a professional mutual fund manager, going every day to work in a suit driving a Mercedes, you have to imagine yourself every day as you would already live like that. Surround yourself with successful persons not with pessimists. And also create your own master mind group, with people that have similar goals and want to succeed. Share your knowledge with them and in exchange you will get knowledge from them.

One of my favorite motivational speakers: Brian Tracy