Algorithmic Trading

Lately I have been lazy to write any blog entries but I have been productive with trading, more specifically regarding my development on the journey to a better trader. I met a good old friend who seems to be doing pretty good in trading. He said his strategies are mostly algorithmic which strengthens my interest towards aromatic trading. I have many times thought about back testing my strategies automatically with coding, but did never give a thought that algorithmic trading was ever an option. 

Algorithmic trading is the act of programming a trading system to work on its own. I mostly thought that is what big firms on Wall Street do and that normal commercial traders would never survive in that world. Most people think that an algorithmic trading strategy is also a quantitative strategy, in which case we are talking about high frequency trading. This is a world of ultra fast trading where nano seconds matter and trades are already made 0,00001 seconds after a news event. Obviously this is where commercial traders have no chances to compete. But an algorithmic trading strategy can also be a system that makes for example "buy and hold" long term investment decisions. A strategy that is automated fully or partly can be an algorithmic strategy. I was eager to learn as much as  possible about algorithmic trading and I think these are the pros and cons of it:

An algorithmic trading system:
+ can work on its own 24/5
+ will exclude all negative effects of the human mentality (greed, fear and inaccurateness)
+ will do a 100% what you program it do 
+ will simultaneously monitor as many markets as you want it to follow

- can be difficult or even impossible to program
- can sometimes lead to "black swans" (negative inexplainable surprises)
- can take a lot of time to develop

I first came up with a  fantastic internet site https://www.quantopian.com, This is a free forum and portal for algorithmic traders and I believe its free because succeeding strategies are copied by the site owner so do not code your biggest trading secrets here. The site has a build in python-based terminal for back testing and live trading. It uses python as its coding language which is pretty easy to learn and powerful. I played a little with it but soon realized I would need at least a +30K trading account to trade with this on an intraday basis. I don´t have the money and the will to sacrifice 30K to my first algorithm which may work or not work.
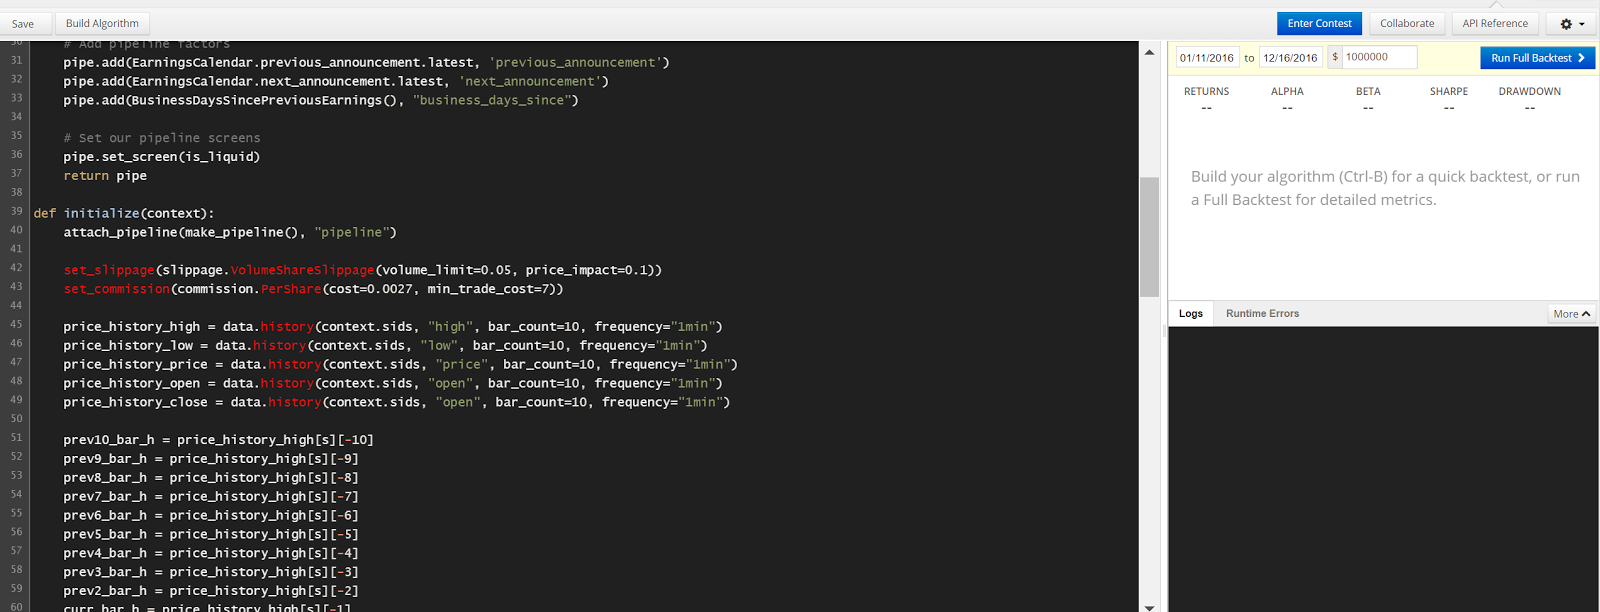

Then I came up with the good old Meta Trader which is offered mostly by forex brokers https://www.metaquotes.net/. The metatrader uses MQL 4& 5 (meta quotes language) as its programming language. The syntax is very similar to C++ which is considered to be a difficult but very powerful language. To me the language seemed first very difficult to understand, but it is getting more clear the more I put time to look into it. So this is where I am right now: I have to master MQL so that I can write my strategy into code.

Intraday News Trading

I usually trade some news events during the week. One of those is the crude inventory release. The number is released every Wednesday at 17:30 (GMT +2) and on US holidays on Thursday at 18:00. This is an exciting news event since it brings a lot of volume into the market. Last Thursday I traded the news only to find myself after a few minutes with a big loss in my account. The news came out as Actual 4.900M Forecast 0.650M Previous -2.976M. That means there is a 7,87 million barrel difference to the previous number. An increase means always more supply and more supply means the price should fall. And so it did for a few minutes. As the first 5 min candle was closed I opened a position at the previous low. Shortly after that the price rapidly increased. I had my stop at 51,64 which is the high of the first candle. The price just kept increasing until my position was closed. Not that I am afraid of losing, but sometimes I have the feeling the market is doing the direct opposite of what it should or at least what I think it should do. I checked that there were no other contradicting news released that could have mixed the sentiments. How on earth did the market analyze the news as bullish for the oil price??!


The price just returned back to its original level like the market would have said "nope you are wrong, I will knock you out!". In my opinion it is not worthy for a single trader like me to enter any trades during the first 5 minute candle: the first 5 minutes tend to be very volatile and entering a trade could be affected by high slippage or an instant stop order. I have also noticed that the market often overreacts and the price will eventually change direction after the first candle like in this case.

Brent Crude Oil

I have been buying crude oil for the last two days. The price has now broken one important level of 51,35. The move was triggered mostly due the inventory report yesterday: A 2,56 million barrel increase was predicted but the actual number came out as a -2,98 million barrel decrease. So that´s a 216% difference and a decrease in supply always works bullish in the demand.

MeetMe Inc. (MEET)

MeetMe, Inc. is a social media technology company that owns and operates the MeetMe mobile applications and meetme.com. The Company is a location-based social network for meeting new people both on the Web and on mobile platforms, including on iPhone, Android, iPad and other tablets that facilitate interactions among users. The Company provides users with access to a menu of resources that promote social interaction, information sharing and other topics of interest. The Company offers online marketing capabilities, which enable marketers to display their advertisements in different formats and in different locations. (google finance)

The stock price is in an accelerating bullish movement well above the 200 day moving average. The price plunged after some director’s offloaded shares in august. This may indicate that the Q3 earnings report will not be as positive as the Q2:


However if the Q3 report is surprisingly positive I am looking forward on buying at 8,20$. 4 analysts have rated the stock as a “buy” and none as “sell” or “underperform”.

Incyte Corporation (INCY)

Incyte Corporation is a biopharmaceutical company. The Company is focused on the discovery, development and commercialization of therapeutics to treat medical needs, primarily in oncology. Forbes listed the company to it´s "Most innovative companies" list. Now the market capitalization is significantly smaller than the other medical giants, but aren´t we looking for growing companies? The company showed this quarter again some really good numbers:
I do not usually follow this kind of patterns, but when the fundamentals and other aspects of my strategy are right, why should I ignore a beautiful trend channel like this. The buy zone starts around 94$ and the first target would be 133$. Of course there is always the chance that the bears might push the stock down so that the channel is broken. Someone might recognize this as a bearish flag.

Update on Sabre Corp. (SABR) 6.9.2016

The stocks price has made a new low and is rising again towards the all-time-high. I am predicting volume increase at levels between 29,66 and 30,60. Buy signal if the price manages to close above 30,60.  
Weekly chart:
Sabre released some solid numbers on the 2nd of August: Quarter over quarter earnings growth 113%, ROE (ttm) 84%, Sales quarter over quarter 19,50%. Despite that the stocks price reacted bearish. Overall the stock is in a bullish cycle.
Daily chart:


Sabre Corporation (SABR)

Sabre is a solution provider in technology for the global travel and tourism industry. The software that the company provides is used by hundreds of airline and hotel companies around the world. Sabre is showing strong earnings, the EPS (quarter over quarter) has grown 85% and annual EPS by 110,40%. Also the sales are up 21%. The ROE is up 93,30% during the trailing twelve months and the stock is also supported by institutions: TBG Group Holdings holds 16,55%, Silver Lake Group 10,83% and Vanguard Group 5,24% etc. The stock is also technically showing a promising pattern (see picture). The stock is recovering  from the previous lows and is near the all-time high about to break through a 1-2-3 pattern. I am excited about the earnings report tomorrow before the market open.

Stock of the week

I am slowly moving away from day trading to swing trading or trend trading, since my daily job does not allow me to follow positions throughout the day. That is why I am working on a strategy which requires me to take a look at the positions after the closing bell. I am not moving away from technical analysis though, but I am increasing the significance of fundamental data. The strategy will follow William O´neill´s strategy and Michael Voigt´s represented "market technique". From this point on I will try to find an interesting stock every week and maybe trade it. I will write a short blog entry about it so that I can in the future look back how my recommended stocks performed. The markets are not good at the moment so I doubt they perform in the near future well.

Dycom Industries Inc. (DY)

Dycom’s business primarily benefits from increased demand for network bandwidth and mobile broadband, given the proliferation of smart phones. The company has been continuously benefiting from extensive deployment of 1-Gigabyte wireline networks by major customers. Most of the telecommunication companies are deploying fiber-to-the-home and fiber-to-the-node technologies to enable video offerings and 1-gigabit high-speed connections, thereby opening up significant opportunities for Dycom. As the picture below shows, the company´s  quarterly and annual numbers look promising. The stock has also a 89% institutional ownership and it´s stock is ranked number one among the competitors according to IBD ( Investors Business Daily).

 The only problem my strategy is facing with this stock is the risk/ reward ratio. Assuming the stock would increase in value by 50% and having a price of 94,98$ the stop order at 46,61$ we get a ratio of 54%. Also considering the order costs, I am risking 46% more than my theoretical profit could be. A good ratio would be above 100%. That is why I am only watching this stock. Maybe the price will form a new bottom soon, so could set the sell stop order on a more reasonable level.


Stress testing your strategy

Unfortunately there are many investors out there who do not appreciate risk management as a crucial part of active investing.  I still often have to count myself in with those people. To succeed in trading it is necessary to pay attention to risk management as much as you do to your entry strategy. I find that value at risk (later abbreviated as VaR) may be one of the very best risk management tools there is by which can calculate your potential loss over a given period at a given confidence interval. This computation tells whether a strategy can survive or not.

How to calculate VaR

To calculate VaR we have to assume the returns of the strategy are normally distributed. 
The returns should be logarithmic returns since we are calculating different instrument´s returns and that are not linked to each other. 

First we need to give the function a confidence level. Usually traders are interested in the bottom 1% of the left hand side of the return distribution. Hence with a 1% probability what is the biggest loss over the given time period?Therefore the confidence level is 99%. Then we need to calculate the standard deviation (STDEV.S) and mean (AVERAGE) return of the strategy. My strategy gave me the numbers 0,188 and 0,045. After that we multiply the portfolio value with the minimum return given by the confidence level (NOMR.INV) and we get an account value of 6072,23€ (with 10K€ starting cap). Subtracting these sums I get a VaR of 3927,76€. That means there is a 1% chance of losing 3927,76€ within one day trading. That is a heck of a lot exposure I´d say. 


When does the music stop?

The right question to ask right now is "when is the bull market going to change into a bear market". Knowing the right answer for this question will make you very profitable or at least it will make you avoid losses. The global GDP´s growth has been slowing down the last 5 years. China´s growth is slowing down. The Eurozone´s debt is increasing year after year. Now take a look at the government debt to GDP charts below.

Chinese government debt/ GDP
EU government debt / GDP

US government debt/ GDP


Everyone understands these graphs can´t keep rising forever...

 Eurozone Debt to GDP %
After Greece comes Italy and then Portugal. Will the same thing that happened to Greece happen to those two last mentioned.  Will the Euro last as a common currency? I would say there is a lot of tension in the air right now and no reason to buy stocks that are following the general market cycle. Stockpicking can still be profitable but I think the time of easy profits and bull market rallies is over. 
This is no investment advice, it is just my opinion. Give it a thought.


Money never sleeps ... even on a saturday night


Lately I have been lazy and lacking inspiration to write about or research the markets.  I have been on a vacation and it is now time to pull myself together and start seriously back testing my new startegy. 

I am working on a strategy that takes into account both fundamental and technical factors. This strategy is a blend O´neills investment philosophy and trend following. Since I have no idea where the markets are heading it is smart to stay outside, observe and research. In Chinese the word "Crisis" means also opportunity, so if we are going to have a period of a bear market I will be then ready when the markets are turning and instruments are undervalued.

To trade like an institution


First of all let us define what an institutional investor is. Investopedia.com defines an institutional investor as follows: A non-bank person or organization that trades securities in large enough share quantities or dollar amounts that they qualify for preferential treatment and lower commissions. Instituional investors face fewer protective regulations because it is assumed that they are more knowledgeable and better able to protect themselves.

Hereby we can assume that investopedia is reffering to pension funds, mutual funds, hedge funds, insurance companies, investment banks etc. The institutional counterpart has a larger amount of equity to invest than an average commercial trader and the reasons why they trade a specific instrument can have various backgrounds: An institution might buy an instrument to close a short position or it might buy so that its mutual fund fills a specific fund criteria. Usually institutional trading can be noticed trough the order book, or watching the trade volume. As per se the institutions trade high volume contracts they might buy in blocks so that the market supply is enough and their market exposure is not too obvious. The funds originate mostly from the customers deposits. As the institution is obligated to maximize the customers returns it simply cannot spray it´s funds around the market. An institution trades relying on a definitive trading strategy. This strategy has been back tested and has been approved by the board. Thus we can define a few important steps to start trading like the big boys do:

1. Create a trading strategy that is easy to understand and has definitive conditions ( can be explicated in a mathematical equation, technical parameters or code) 


2. Back test the strategy (e.g. manually or by programming it). Try to be as realistic and objective as possible. 


3. If the strategy shows satisfying returns write the strategy down and hang it on the wall next to your trading station


4. Trade ONLY on the basis of the strategy! Rely on your strategy since it has proven to be somewhat profitable in the back testing phase. Every strategy shows negative returns at times. These periods may take several days to weeks, even months.


5. Put every trade in a table (e.g. an excel sheet) and derive statistics from them. Every trade has to be written down and rationalized with your strategy. In the future you can then look back at the failures and even try to avoid them in the future. 

My recent trades

Delta Air Lines (DAL) long position
 Facebook (FB) Long position
Fresenius Medical (FMEG) Long position 
 Neopost (NPOS) Short position
Axel Springer (SPRG) Long position ended up with a huge loss here. The market took my position out with the trailing stop order. Should have avoided the big candles. 

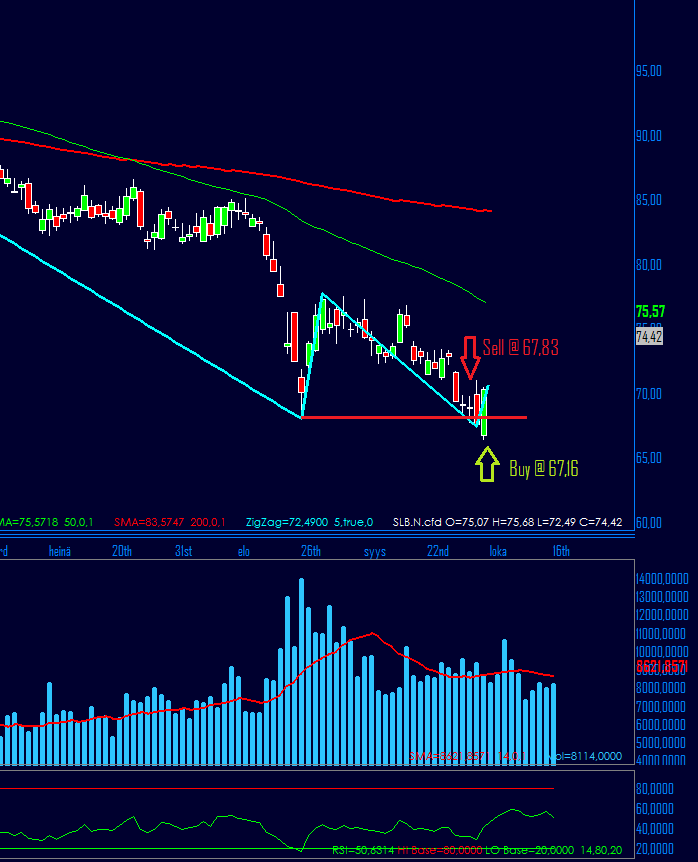
Schlumberger (SLB) Short position


Will the Dax go further down?

We can see a similar drop on the DAX as on the 31.7.2011 but only now there is some significant volume. If the German stock index is about to plunge more, we have good opportunities to sell short. The trend is bearish on the daily chart but looking at the bigger picture on the weekly chart we still can talk about a correction.

My recent position trades

 Deutsche Telekom (DTEGn) on a 4 hour chart. Buy @ 16,640 because crossover point 2. Sell via trailing stop.

Hochtief (HOTG) on a 4 hour chart. Buy @ 72,393 sell at 75,527. Buy because of crossover point 2. Trailing stop exit. 
 Osram Licht (OSRn) on a 4 hour chart. Buy at 50,813 sell at 53,890. Signal was given by market crossing over point 2. Trailing stop exit.


Keep calm and follow your trading plan

.. is something that is good to repeat to yourself, when a position runs against you or a friend tells you about a new "hot stock". I am nobody to tell you about success in trading, but as much as I have observed other traders, the ones who make trading decisions on a gut feeling end up loosing their money. Also traders who allocate all their equity on one instrument often end up being wrong. 

As much as I know, professional traders do not trade like this. The winners are the ones who have a very specific trading plan. The trading plan has been tested and implemented and a track record of years proves that it works. Success in trading is not about risking all equity in one good trade. It is about a system that tends to beat the market on the longer term. A system with tight stops for example, can be profitable even if it is 1/5 times right. The stops cut the losses short and the winning trade breaks the losses even. "let your winners run" is a phrase which you can read in many books. It is true but you should never limit your scope with phrases like this. Some traders are satisfied with as little as 10 pips per day. These traders could make the 10 pips in the morning and then do something else. 10 pips does not sound like much but imagine trading those 10 pips with large volume. 

Moreover it is important to keep some kind of track of your trades. Imagine trading endlessly and never making one note of your past trades. That way you could not draw any conclusions from you trades. An Excel sheet comes in very handy for this specific matter. In excel you could keep very good track of your trades. One could make a table which computes the standard deviation of the returns, derive volatility from the standard deviation and then calculate the VaR (value at risk) on a daily basis. Also a last touch could be adding a column where one could add always the signal or reason why the specific trade was executed. This way one could always look back at the failures and analyze how to avoid them in the future.

Technical & fundamental data working together on the EURODOLLAR


On the 2nd of June there was a news event where the change of the European Consumer Price Index was announced in percentages. In the picture below we have the EUR/USD pair on a hourly chart. The change was announced at 12:00 am (GMT +2) at the same time the currency was on a significant technical level of 1,10061 which was the previous high. According to the market structure crossing this level triggered some buy orders, which already stood in the orderbook. Therefore the currency launched to a strong intraday trend. In the picture the blue line indicates when the change was announced and the red line indicates a trailing stop scenario. Underneath we have the volume indicator to indicate the significance of this event.


Understanding (technical) market structure


Let us start with the picture above. We have three types of bullish trends: the accelerating bullish trend A, the regular bullish trend B and the decelerating bullish trend C. In an accelerating bullish trend the price makes higher highs and lows alternately making a "convex" slope. The trend is considered to be stronger than the trends B and C. The trend C again is losing momentum and is drawing a more "concave" pattern.

 We can find some theoretical "support" points and draw trend lines (yellow with trend A, orange with trend B and grey with trend C). In the trends A and B, one has to draw multiple lines, because the trends momentum is increasing/ decreasing. In trend B the trader is satisfied to draw only one line, which runs through all lows of the price slope.

One can find very effective entry points at the price level where the price embarks through the previous highs level (E). Adding a volume  indicator or looking at the order book at these levels, usually shows some significant order flow. This is where market technique oriented traders (private and institutional) traders enter their position. A trend following trader could set his/ her stop orders at the previous lows level. E.g. Entry at point E1. After the entry the trader wants to protect his/ her position and puts a stop order to the level S1 (only after the price has significantly risen through E1!)

A bullish trend makes alternately higher highs and lows. To exit the train at the right stop we have to understand when the trend has been broken and when it is reversing. Point B1 is the first lower low to appear ( its level is below the previous low). Many traders might hesitate and close their position now, where the trend might as well continue in the initial direction. However the price does another peak B2 which is a lower high. The price continues to drop below the previous lows level B3. Now the trend is considered to be reversed ( bearish) This is the last point where one should get rid of the position. Here the price usually makes rapid movements, since traders have set their stops here and some of them are changing from optimist to pessimist and reversing their position. This causes strong volume on the sell side.

This concept can be used from tick-time frames to weekly charts, but one has to keep in mind that the superior time frames set the major "winds" of the market: it is recommended to trade a bullish trend on the shorter time frames, when the trend is also bullish on the longer time frames.

SANOFI

The beginning of april gave some strong bullish signals. One of them occured with the sanofi´s stock. The conditions were one every timeframe bullish. I opened the position on the 1 of april at 93,46€ and it got closed due the stop order on the market opening of the 16th of april due an gap down at 97,39€.

A couple of trades

These trades were rather following a position trading strategy since they were kept through several days. The first one was traded with the BNRGn (Brenntag Ag). Open at 53,53 and close at 55,16 with a 163 point difference. The first picture illustrates the instrument on the daily chart. We can see that the price had just recovered from a minor drop and the trend is strong bullish. 


 BNRGn (Brenntag Ag) on the 15 minute chart where the trade was executed. This is  one of those trades where I placed the stop order just right. The price started oscillating with high volatility just after the position was closed on the 17th of march. Green line entry, red line exit. 

 The second trade was executed also with a stock derivative of the German market. G1AG (Gea Group) Firstly the daily chart, then the 15 minute chart.

 The picture does not quite show that actually the the first low in the picture is many points below the second (higher) low. This observation made me trade this movement. The exit was executed with a market order, since the stop was  lying down at 43,90 and the instrument started showing reversal signs on the 17th ( a reversed 1-2-3 pattern).

Where the first two trades were long positions, the third was held short. This was exercised with the CHK (Chesapeake). This stock has been extremely bearish since the middle of 2014. The position was entered at 15,04 where the price broke through the last low. The 15 minute chart illustrates that the entry point had clearly some bearish volume, since the price plunged immediately. The position was closed manually with a market order due to a possible reversal. A 103 point trade.