My recent trades

Delta Air Lines (DAL) long position
 Facebook (FB) Long position
Fresenius Medical (FMEG) Long position 
 Neopost (NPOS) Short position
Axel Springer (SPRG) Long position ended up with a huge loss here. The market took my position out with the trailing stop order. Should have avoided the big candles. 

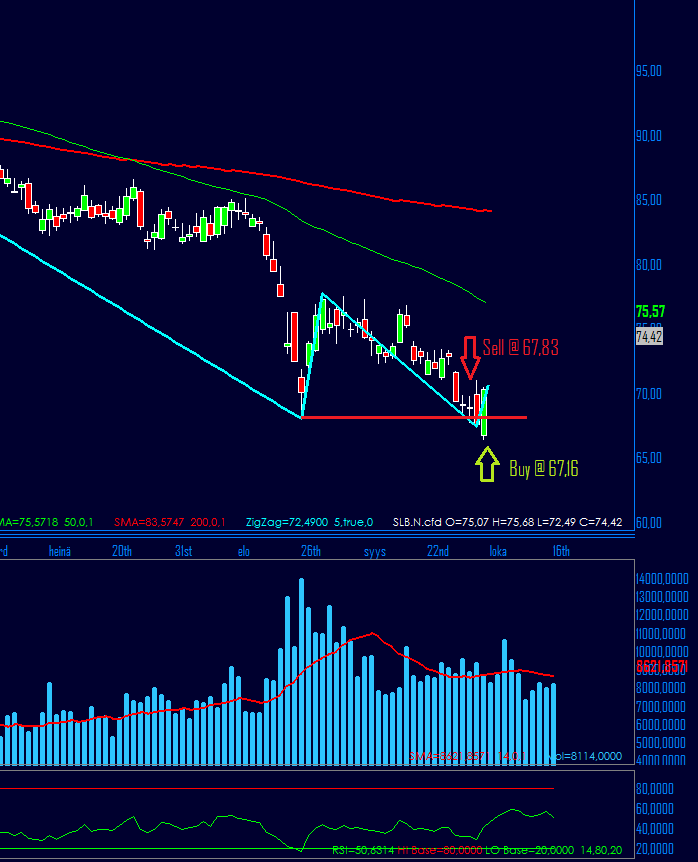
Schlumberger (SLB) Short position


Will the Dax go further down?

We can see a similar drop on the DAX as on the 31.7.2011 but only now there is some significant volume. If the German stock index is about to plunge more, we have good opportunities to sell short. The trend is bearish on the daily chart but looking at the bigger picture on the weekly chart we still can talk about a correction.

My recent position trades

 Deutsche Telekom (DTEGn) on a 4 hour chart. Buy @ 16,640 because crossover point 2. Sell via trailing stop.

Hochtief (HOTG) on a 4 hour chart. Buy @ 72,393 sell at 75,527. Buy because of crossover point 2. Trailing stop exit. 
 Osram Licht (OSRn) on a 4 hour chart. Buy at 50,813 sell at 53,890. Signal was given by market crossing over point 2. Trailing stop exit.


Keep calm and follow your trading plan

.. is something that is good to repeat to yourself, when a position runs against you or a friend tells you about a new "hot stock". I am nobody to tell you about success in trading, but as much as I have observed other traders, the ones who make trading decisions on a gut feeling end up loosing their money. Also traders who allocate all their equity on one instrument often end up being wrong. 

As much as I know, professional traders do not trade like this. The winners are the ones who have a very specific trading plan. The trading plan has been tested and implemented and a track record of years proves that it works. Success in trading is not about risking all equity in one good trade. It is about a system that tends to beat the market on the longer term. A system with tight stops for example, can be profitable even if it is 1/5 times right. The stops cut the losses short and the winning trade breaks the losses even. "let your winners run" is a phrase which you can read in many books. It is true but you should never limit your scope with phrases like this. Some traders are satisfied with as little as 10 pips per day. These traders could make the 10 pips in the morning and then do something else. 10 pips does not sound like much but imagine trading those 10 pips with large volume. 

Moreover it is important to keep some kind of track of your trades. Imagine trading endlessly and never making one note of your past trades. That way you could not draw any conclusions from you trades. An Excel sheet comes in very handy for this specific matter. In excel you could keep very good track of your trades. One could make a table which computes the standard deviation of the returns, derive volatility from the standard deviation and then calculate the VaR (value at risk) on a daily basis. Also a last touch could be adding a column where one could add always the signal or reason why the specific trade was executed. This way one could always look back at the failures and analyze how to avoid them in the future.

Technical & fundamental data working together on the EURODOLLAR


On the 2nd of June there was a news event where the change of the European Consumer Price Index was announced in percentages. In the picture below we have the EUR/USD pair on a hourly chart. The change was announced at 12:00 am (GMT +2) at the same time the currency was on a significant technical level of 1,10061 which was the previous high. According to the market structure crossing this level triggered some buy orders, which already stood in the orderbook. Therefore the currency launched to a strong intraday trend. In the picture the blue line indicates when the change was announced and the red line indicates a trailing stop scenario. Underneath we have the volume indicator to indicate the significance of this event.


Understanding (technical) market structure


Let us start with the picture above. We have three types of bullish trends: the accelerating bullish trend A, the regular bullish trend B and the decelerating bullish trend C. In an accelerating bullish trend the price makes higher highs and lows alternately making a "convex" slope. The trend is considered to be stronger than the trends B and C. The trend C again is losing momentum and is drawing a more "concave" pattern.

 We can find some theoretical "support" points and draw trend lines (yellow with trend A, orange with trend B and grey with trend C). In the trends A and B, one has to draw multiple lines, because the trends momentum is increasing/ decreasing. In trend B the trader is satisfied to draw only one line, which runs through all lows of the price slope.

One can find very effective entry points at the price level where the price embarks through the previous highs level (E). Adding a volume  indicator or looking at the order book at these levels, usually shows some significant order flow. This is where market technique oriented traders (private and institutional) traders enter their position. A trend following trader could set his/ her stop orders at the previous lows level. E.g. Entry at point E1. After the entry the trader wants to protect his/ her position and puts a stop order to the level S1 (only after the price has significantly risen through E1!)

A bullish trend makes alternately higher highs and lows. To exit the train at the right stop we have to understand when the trend has been broken and when it is reversing. Point B1 is the first lower low to appear ( its level is below the previous low). Many traders might hesitate and close their position now, where the trend might as well continue in the initial direction. However the price does another peak B2 which is a lower high. The price continues to drop below the previous lows level B3. Now the trend is considered to be reversed ( bearish) This is the last point where one should get rid of the position. Here the price usually makes rapid movements, since traders have set their stops here and some of them are changing from optimist to pessimist and reversing their position. This causes strong volume on the sell side.

This concept can be used from tick-time frames to weekly charts, but one has to keep in mind that the superior time frames set the major "winds" of the market: it is recommended to trade a bullish trend on the shorter time frames, when the trend is also bullish on the longer time frames.

SANOFI

The beginning of april gave some strong bullish signals. One of them occured with the sanofi´s stock. The conditions were one every timeframe bullish. I opened the position on the 1 of april at 93,46€ and it got closed due the stop order on the market opening of the 16th of april due an gap down at 97,39€.