Stock of the week

I am slowly moving away from day trading to swing trading or trend trading, since my daily job does not allow me to follow positions throughout the day. That is why I am working on a strategy which requires me to take a look at the positions after the closing bell. I am not moving away from technical analysis though, but I am increasing the significance of fundamental data. The strategy will follow William O´neill´s strategy and Michael Voigt´s represented "market technique". From this point on I will try to find an interesting stock every week and maybe trade it. I will write a short blog entry about it so that I can in the future look back how my recommended stocks performed. The markets are not good at the moment so I doubt they perform in the near future well.

Dycom Industries Inc. (DY)

Dycom’s business primarily benefits from increased demand for network bandwidth and mobile broadband, given the proliferation of smart phones. The company has been continuously benefiting from extensive deployment of 1-Gigabyte wireline networks by major customers. Most of the telecommunication companies are deploying fiber-to-the-home and fiber-to-the-node technologies to enable video offerings and 1-gigabit high-speed connections, thereby opening up significant opportunities for Dycom. As the picture below shows, the company´s  quarterly and annual numbers look promising. The stock has also a 89% institutional ownership and it´s stock is ranked number one among the competitors according to IBD ( Investors Business Daily).

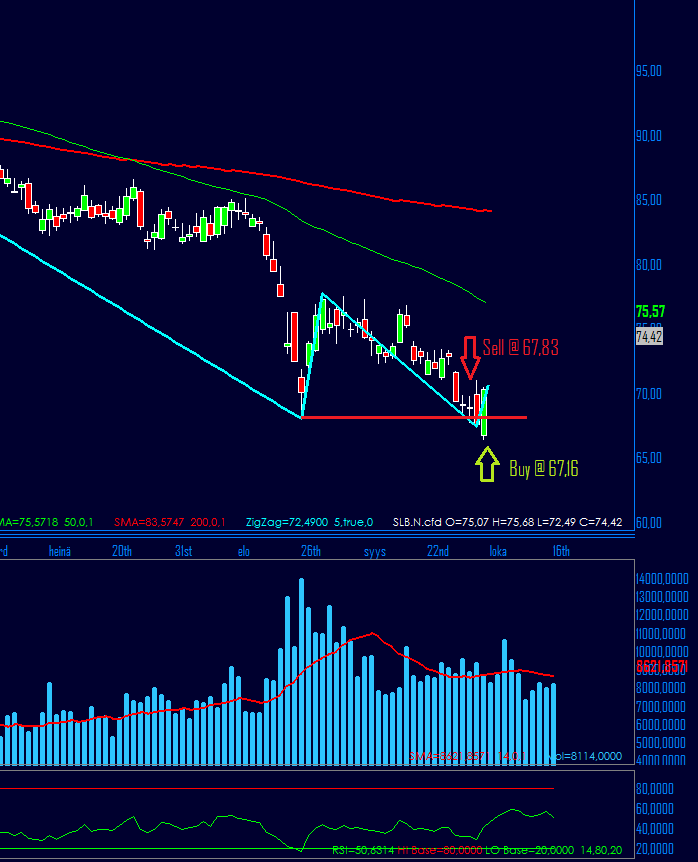
 The only problem my strategy is facing with this stock is the risk/ reward ratio. Assuming the stock would increase in value by 50% and having a price of 94,98$ the stop order at 46,61$ we get a ratio of 54%. Also considering the order costs, I am risking 46% more than my theoretical profit could be. A good ratio would be above 100%. That is why I am only watching this stock. Maybe the price will form a new bottom soon, so could set the sell stop order on a more reasonable level.


Stress testing your strategy

Unfortunately there are many investors out there who do not appreciate risk management as a crucial part of active investing.  I still often have to count myself in with those people. To succeed in trading it is necessary to pay attention to risk management as much as you do to your entry strategy. I find that value at risk (later abbreviated as VaR) may be one of the very best risk management tools there is by which can calculate your potential loss over a given period at a given confidence interval. This computation tells whether a strategy can survive or not.

How to calculate VaR

To calculate VaR we have to assume the returns of the strategy are normally distributed. 
The returns should be logarithmic returns since we are calculating different instrument´s returns and that are not linked to each other. 

First we need to give the function a confidence level. Usually traders are interested in the bottom 1% of the left hand side of the return distribution. Hence with a 1% probability what is the biggest loss over the given time period?Therefore the confidence level is 99%. Then we need to calculate the standard deviation (STDEV.S) and mean (AVERAGE) return of the strategy. My strategy gave me the numbers 0,188 and 0,045. After that we multiply the portfolio value with the minimum return given by the confidence level (NOMR.INV) and we get an account value of 6072,23€ (with 10K€ starting cap). Subtracting these sums I get a VaR of 3927,76€. That means there is a 1% chance of losing 3927,76€ within one day trading. That is a heck of a lot exposure I´d say. 


When does the music stop?

The right question to ask right now is "when is the bull market going to change into a bear market". Knowing the right answer for this question will make you very profitable or at least it will make you avoid losses. The global GDP´s growth has been slowing down the last 5 years. China´s growth is slowing down. The Eurozone´s debt is increasing year after year. Now take a look at the government debt to GDP charts below.

Chinese government debt/ GDP
EU government debt / GDP

US government debt/ GDP


Everyone understands these graphs can´t keep rising forever...

 Eurozone Debt to GDP %
After Greece comes Italy and then Portugal. Will the same thing that happened to Greece happen to those two last mentioned.  Will the Euro last as a common currency? I would say there is a lot of tension in the air right now and no reason to buy stocks that are following the general market cycle. Stockpicking can still be profitable but I think the time of easy profits and bull market rallies is over. 
This is no investment advice, it is just my opinion. Give it a thought.


Money never sleeps ... even on a saturday night


Lately I have been lazy and lacking inspiration to write about or research the markets.  I have been on a vacation and it is now time to pull myself together and start seriously back testing my new startegy. 

I am working on a strategy that takes into account both fundamental and technical factors. This strategy is a blend O´neills investment philosophy and trend following. Since I have no idea where the markets are heading it is smart to stay outside, observe and research. In Chinese the word "Crisis" means also opportunity, so if we are going to have a period of a bear market I will be then ready when the markets are turning and instruments are undervalued.

To trade like an institution


First of all let us define what an institutional investor is. Investopedia.com defines an institutional investor as follows: A non-bank person or organization that trades securities in large enough share quantities or dollar amounts that they qualify for preferential treatment and lower commissions. Instituional investors face fewer protective regulations because it is assumed that they are more knowledgeable and better able to protect themselves.

Hereby we can assume that investopedia is reffering to pension funds, mutual funds, hedge funds, insurance companies, investment banks etc. The institutional counterpart has a larger amount of equity to invest than an average commercial trader and the reasons why they trade a specific instrument can have various backgrounds: An institution might buy an instrument to close a short position or it might buy so that its mutual fund fills a specific fund criteria. Usually institutional trading can be noticed trough the order book, or watching the trade volume. As per se the institutions trade high volume contracts they might buy in blocks so that the market supply is enough and their market exposure is not too obvious. The funds originate mostly from the customers deposits. As the institution is obligated to maximize the customers returns it simply cannot spray it´s funds around the market. An institution trades relying on a definitive trading strategy. This strategy has been back tested and has been approved by the board. Thus we can define a few important steps to start trading like the big boys do:

1. Create a trading strategy that is easy to understand and has definitive conditions ( can be explicated in a mathematical equation, technical parameters or code) 


2. Back test the strategy (e.g. manually or by programming it). Try to be as realistic and objective as possible. 


3. If the strategy shows satisfying returns write the strategy down and hang it on the wall next to your trading station


4. Trade ONLY on the basis of the strategy! Rely on your strategy since it has proven to be somewhat profitable in the back testing phase. Every strategy shows negative returns at times. These periods may take several days to weeks, even months.


5. Put every trade in a table (e.g. an excel sheet) and derive statistics from them. Every trade has to be written down and rationalized with your strategy. In the future you can then look back at the failures and even try to avoid them in the future. 

My recent trades

Delta Air Lines (DAL) long position
 Facebook (FB) Long position
Fresenius Medical (FMEG) Long position 
 Neopost (NPOS) Short position
Axel Springer (SPRG) Long position ended up with a huge loss here. The market took my position out with the trailing stop order. Should have avoided the big candles. 

Schlumberger (SLB) Short position


Will the Dax go further down?

We can see a similar drop on the DAX as on the 31.7.2011 but only now there is some significant volume. If the German stock index is about to plunge more, we have good opportunities to sell short. The trend is bearish on the daily chart but looking at the bigger picture on the weekly chart we still can talk about a correction.